Technology Valuation: Like Sorting Diamonds

Ever gone shopping for diamonds? Then you’re probably familiar with the “4Cs” of diamond quality: color, clarity, cut and carat weight. Thanks to the GIA (Gemological Institute of America), these 4Cs are the globally accepted standard for judging diamond quality. As the GIA website states, the acceptance of the 4Cs as the standard meant that “diamond quality could be communicated in a universal language, and diamond customers could now know exactly what they were about to purchase.”
Moreover, GIA has developed detailed scales for color and clarity ratings, and objective descriptors for cut characteristics, in addition to the longstanding quantitative expression of diamond weight in carats. So, although a diamond’s beauty is still in the subjective eye of the buyer, this beauty can be objectively translated to an established set of diamond characteristics.
Technology valuation is not yet as codified and standardized as the GIA’s 4Cs. However, there are both market impact characteristics and technology characteristics that together define the value of a given technology or a folio of technologies. Let’s call these characteristics the “5 Ms” and the “3 Ts”. The “Ms” are descriptors for the impact of the technology on market position or profit margin. The “Ts” are descriptors of the stage of development of the technology. Let’s consider the following valuation case study which illustrates how an analysis of these characteristics leads to a technology folio value.
The situation requiring a technology valuation was a company’s planned sale of its entire set of product/technology portfolios to a third party. The case challenge was to estimate the value of the entire set using existing information and characterizations of the folios (i.e., no new efforts to be expended). The valuation solution was to use a “value mapping” approach, with a “value grid” constructed from the existing client’s characterizations of the market impact and technology stage for each unique folio. Figure 1 shows the grid that resulted from mapping the client’s characterization of the market position that each of the technology folios had enabled the company to achieve in its competitive markets against the Technology Stage of development. The Market Position axis was developed from interviews with client staff. The royalty rate percentages shown on the Technology Stage axis were developed from industry-specific royalty rates compiled from public sources. Each unique technology folio is represented by a numbered circle.
Figure 1. Valuation Case Study: Value Grid Mapping
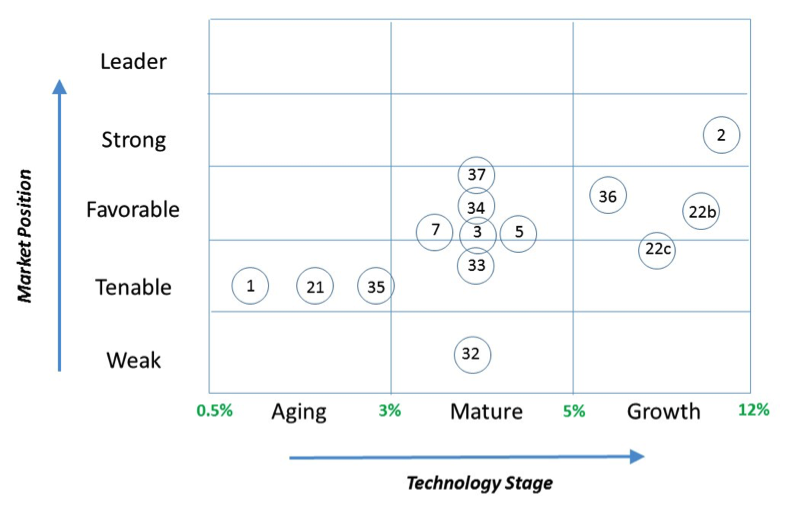
After the full grid was populated, the royalty rate for each folio was assigned and applied to the known annual sales value attributed to each folio. The result was an estimated “annual royalty” value of the corresponding technology folio. The annual royalty rate ranged from a low of about $1 million for the folios in the 1% royalty range and a high of about $11 million for the folios in the 5% range. Royalty estimates across all folios totaled about $25 million.
What would a third party investor pay for product/technology folios that produce an annual royalty stream of $25 million? Well, that depends upon the investor’s alternative available investments and his target return on investment. But the application of the “5 Ms” and “3 Ts” has resulted in an objective assessment of this client’s technology folio that can serve as the basis for discussion and negotiation. Moreover, this assessment can be easily revisited in the event of changes due to shifts in market demand or sudden technology obsolescence.
- See the Future – Choose Your Future - August 22, 2017
- Technology Valuation: Like Sorting Diamonds - November 16, 2016